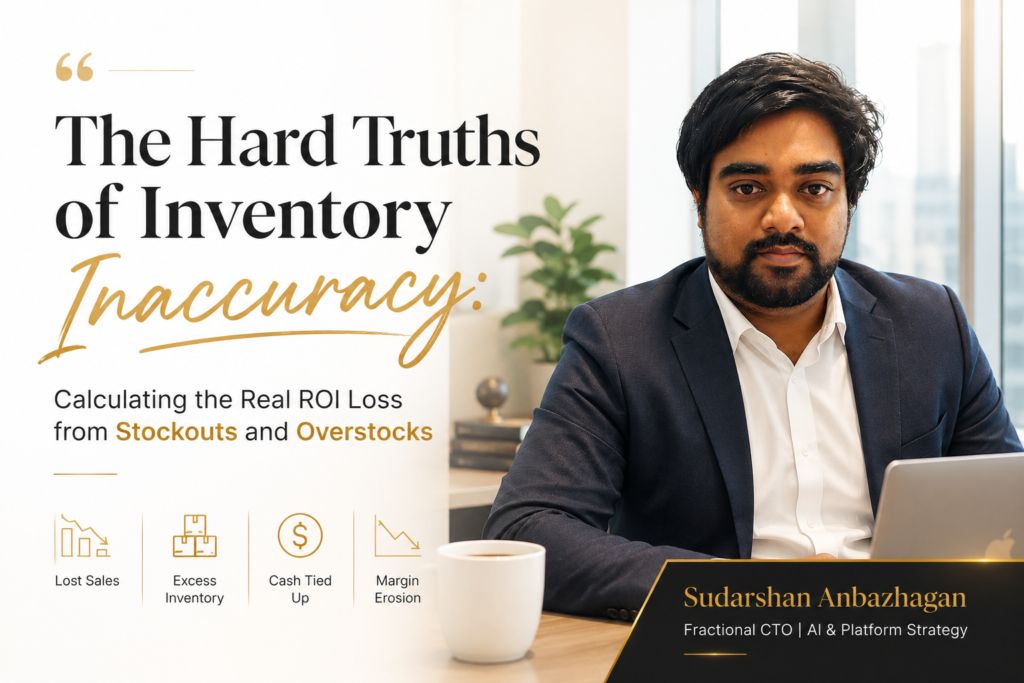

Inventory Inaccuracy ROI: The Real Cost of Stockouts and Overstocks
The number that changes a leadership conversation is rarely the one on the slide. It is the one nobody calculated. I have sat with CFOs who could recite their gross margin to the decimal point, walked me through quarterly variance analysis without hesitation, and presented board-ready financial summaries with complete confidence. But when I asked a single question, what did inventory inaccuracy cost your business last year, the room went quiet. Not because the number was small. Because nobody had ever actually added it up.
This is one of the most consistent patterns I encounter across operations engagements in the US, UK, and Europe. Businesses that track revenue, monitor costs, and review margins with discipline still operate with a blind spot sitting directly inside their supply chain. Inventory inaccuracy does not announce itself on a P&L as a line item. It hides across four separate categories that look, on the surface, like completely different business problems. That is exactly why it stays untracked for so long, and exactly why the cumulative damage it creates is so significant.
After fifteen years of working with operations teams across fourteen countries, I have seen this pattern repeat in businesses of every size and sector. The organisations that finally calculate the real cost of their inventory inaccuracy ROI loss almost always describe the same reaction: the number reframes every technology investment and process improvement conversation they had been delaying. Because inventory inaccuracy is never free. It is only untracked.
Why Inventory Inaccuracy ROI Loss Hides on Your P&L
The reason most leadership teams do not see the full cost of inventory inaccuracy is structural, not intentional. Finance tracks what categories exist on the chart of accounts. Operations manages what is visible within their workflow. The intersection, where inventory decisions create financial outcomes, is rarely owned by a single function with a mandate to measure it completely. This is not a failure of intelligence or effort. It is a failure of framing.
When a stockout occurs, it is logged as a fulfilment issue. When overstock builds up, it appears as an inventory holding cost. When emergency procurement is triggered, it surfaces as a freight variance. When decision quality degrades due to bad data, it never surfaces at all. Each of these looks like a separate operational incident. In reality, they are four expressions of the same root condition: inventory inaccuracy driving predictable financial loss.
The leaders who solve this do not just fix the individual symptoms. They calculate the aggregate, name the number, and bring it to the right level of the organisation with enough clarity to justify the investment required to address it properly. That calculation starts by understanding exactly where the money is going.
The Four Places Your Inventory Inaccuracy ROI Is Silently Disappearing
In every operations engagement where I have helped a leadership team quantify their inventory performance gap, the loss consistently surfaces across four categories. The proportions differ by industry and business model, but the categories are almost always the same.
Stockout Revenue Loss is the most visible category, but it is almost always underreported at the SKU level. Every unavailable product represents a sale that left your business. In some cases the customer returns and waits. In many cases, especially in retail, manufacturing supply, and e-commerce, they find a competitor who had the stock and your relationship with that customer shifts permanently. The standard metric, lost sales volume, captures part of this. What it rarely captures is the downstream impact on customer lifetime value, repeat purchase behaviour, and the brand erosion that accumulates when a customer experiences a stockout once, then twice, then a third time.
Overstock Capital Lock is the quieter drain. Inventory sitting past its optimal holding window is not neutral. It is frozen working capital earning nothing, consuming storage costs, and accumulating depreciation risk with every passing day. The opportunity cost is real and compounding: every pound or dollar tied up in slow-moving stock is capital that cannot be deployed toward growth, toward supplier terms improvement, or toward the technology investments the business keeps deferring. I have worked with operations leaders who understood their inventory holding cost in general terms but had never run the SKU-level calculation across their full catalogue. When they did, the number consistently exceeded their initial estimate by a significant margin.
Emergency Procurement Premium changes the unit economics of purchasing in ways that are rarely fully visible until someone adds them up quarterly. A stockout that triggers an urgent reorder does not just cost the expedited freight charge. It costs the premium supplier rate applied under time pressure, the operational attention pulled away from planned work into crisis mode, and the relationship credibility with suppliers who begin to factor your unpredictability into their own pricing decisions over time. Businesses that run frequent emergency procurement cycles are paying a structural premium on their cost of goods that would not exist if their inventory accuracy supported reliable forward planning.
Decision Quality Degradation is the category that is hardest to quantify and has the deepest long-term impact. When buying decisions are made on inaccurate inventory data, every downstream decision inherits the error. Forecasting models produce unreliable outputs. Supplier negotiations happen from a position of incomplete information. Cash flow planning loses the precision it needs to be genuinely useful at the board level. The organisations that live inside this problem long enough begin to normalise the inaccuracy. Teams build workarounds. Manual checks become standard practice. And the investment required to fix the root cause keeps getting deferred because the workarounds make the business feel functional even while the underlying cost continues to accumulate. This is the pattern I referenced in my post on eliminating manual data entrymanual interventions that feel necessary are often evidence of a deeper data integrity problem that the business has learned to manage rather than solve.
Calculating Inventory Inaccuracy ROI: Where to Start
The calculation does not need to be exhaustive to be useful. In my experience, a focused analysis of the four categories above, even with conservative estimates, produces a number that is large enough to change the internal conversation about investment priority. The goal of the first pass is not precision. It is clarity about the order of magnitude.
Start with stockout frequency at the SKU level over the last twelve months. Apply your average transaction value per stockout incident and a conservative estimate of the percentage of those sales that were permanently lost rather than delayed. The result is a baseline for stockout revenue loss. Then pull your slow-moving inventory report, calculate the capital tied up in stock that has been sitting beyond your optimal holding window, and apply your cost of capital to that figure. Add your emergency procurement spend from the last twelve months. Even these three categories, without attempting to quantify decision quality degradation, typically produce a number that surprises leadership teams who believed they had a reasonable handle on their inventory ROI performance.
The organisations that conduct this analysis honestly almost always find that the number justifies a technology investment, a process redesign, or both, that they had been treating as a future priority rather than an immediate one. The investment was always defensible. The number just had not been calculated clearly enough to make the case at the right level.
Why Leadership Ownership Is the Missing Variable in Inventory Inaccuracy
One of the most consistent observations I carry from operations engagements is this: inventory accuracy problems are almost never solved by operations teams working harder. They are solved when a named executive decides that the current level of loss is no longer acceptable and takes structural accountability for the outcome. This is not about blame. It is about the reality that inventory ROI sits at the intersection of operations, finance, and procurement, and problems that sit at intersections are rarely resolved without someone formally owning the junction.
The businesses that make the most progress fastest are the ones that appoint a single executive accountable for the cash impact of inventory decisions, measured at a cadence that keeps the number visible and the accountability real. That leader connects the dots between the four categories above, brings the aggregate to the board conversation, and creates the internal pressure required to prioritise the process improvements and technology investments that address the root causes rather than the symptoms. Without that named ownership, the four categories continue to operate as separate operational incidents, and the cumulative cost continues to be invisible.
This connects directly to a point I made in my post on real-time operational visibility: the organisations that close the gap between data and decision-making fastest are the ones where accountability for outcomes is clear at the executive level. Inventory accuracy is no different. The data exists in most systems. The missing ingredient is almost always the ownership structure that makes acting on it someone’s formal responsibility.
The Investment Conversation This Number Unlocks
Once a leadership team has calculated the real aggregate cost of their inventory inaccuracy across all four categories, the investment conversation changes entirely. Technology investments that were previously framed as operational improvements become financially defensible in terms that resonate at the board level. Process redesign initiatives that seemed like future priorities become immediately justifiable when measured against the quarterly cost of the status quo. The business case was always there. The calculation is what makes it visible.
I have seen this realisation change the pace of decision-making inside organisations that had been deferring inventory improvements for years. Not because leadership was resistant, but because the cost had never been presented as a unified number with clear ownership. The moment it was, the conversation moved from whether to invest to how to sequence the investment most effectively. That sequence question is one I work through with operations leaders regularly, because the order in which you address the four categories matters. Getting the right fix in the wrong sequence can temporarily improve one metric while leaving another untouched or making it worse.
If you calculated the cumulative cost of these four categories in your operation over the last twelve months, what would that number tell you about your next investment priority? The organisations that ask that question honestly, and stay with the answer long enough to follow it to a decision, are the ones that build operations where inventory inaccuracy is no longer the untracked cost that quietly determines what the margins are actually capable of achieving.