
Managed Team Performance Metrics Without the Reporting Overhead
Ask most engineering leaders whether delivery actually improved this month and very few can answer in under ten seconds. Not because the data does not exist. Usually there is too much of it. Dashboards multiply, weekly decks grow another tab, and somewhere in that expansion the original question gets buried under the very managed team performance metrics that were supposed to answer it.
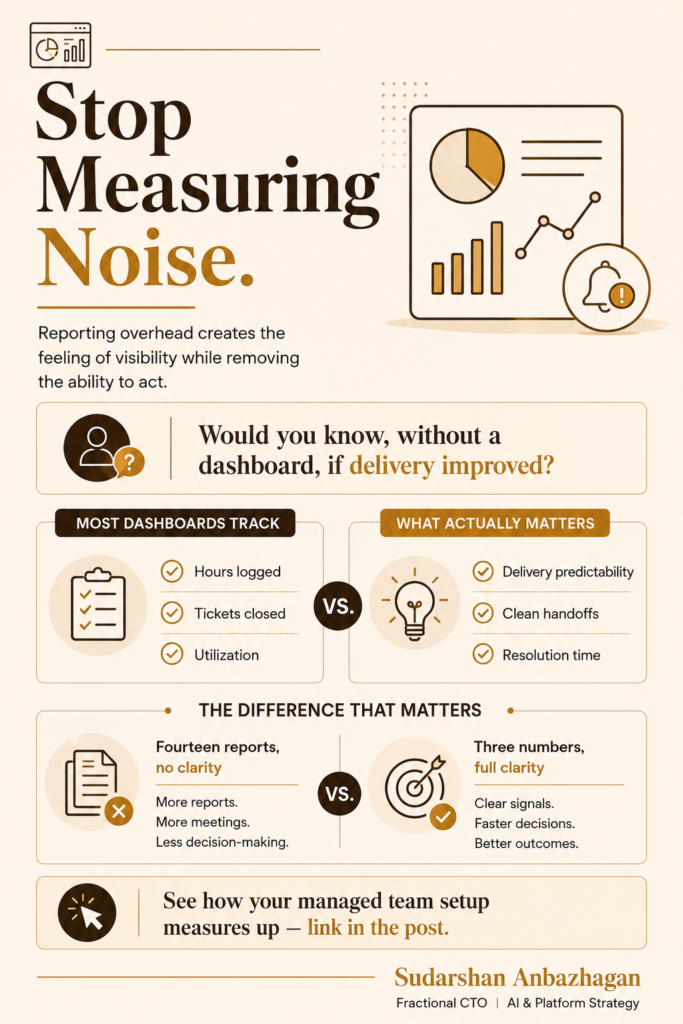
This is the paradox I see repeatedly across managed team engagements. Reporting overhead creates the feeling of visibility while quietly removing the ability to act on anything, because when every metric looks equally important, nothing looks urgent enough to fix first. Leadership ends up with more meetings about the numbers and less clarity about what those numbers are actually telling them.
Across SuperBotics’ engagements managing distributed delivery pods for clients in the US, UK, and Europe, the pattern holds with remarkable consistency. Teams that report the most rarely perform the best. Teams that report the right three things almost always do.
Why Managed Team Performance Metrics Multiply Past the Point of Usefulness
Reporting tends to grow the same way any unmanaged process grows, one reasonable addition at a time. A client asks for a new field. A manager wants a chart added for a specific concern. None of these requests is unreasonable in isolation, and that is exactly the problem. Six months later, a weekly report that started as three numbers has become a fifteen tab spreadsheet that nobody reads end to end, including the person who built it.
Once a report grows past a certain point, it stops functioning as a decision tool and starts functioning as an artefact of activity. Everyone can point to it as proof that oversight exists. Almost nobody can use it to make a specific call about where to intervene this week. That gap between reporting and deciding is where most managed team performance problems actually hide, not in the underlying delivery work itself.
The Three Numbers That Survive Every Cut
I have stopped trusting any managed team dashboard with more than five metrics on it. In practice, three numbers tell you almost everything that matters, and every additional metric beyond those three tends to dilute attention rather than add insight.
Add a sixth metric to a team dashboard and you rarely get more insight. You get more meetings about the first three.
| Metric | What It Actually Tells You | What It Replaces |
|---|---|---|
| Delivery predictability | Whether commitments made are commitments kept | Story point velocity charts |
| Handoff cleanliness | How much rework happens between roles | Individual utilisation percentages |
| Request to resolution time | How long value actually takes to reach the client | Hours logged per ticket |
Each of these three connects directly to a business outcome a client or executive actually cares about. None of them requires a new dashboard tool or an additional reporting layer. They require the discipline to stop adding metrics simply because a new one becomes easy to track, and to start asking whether an existing metric is earning its place on the page.
The Ownership Clarity Framework
Over years of managing distributed delivery pods, I rely on what I call the Ownership Clarity Framework whenever a managed team’s reporting has grown past the point of usefulness. It reduces almost any bloated reporting structure back to three questions, each tied to one of the three metrics above.
- Is the number owned by one person. A metric with two owners is a metric nobody actually watches closely, because each assumes the other is tracking it.
- Does the number change behaviour before the next report. If a metric only gets discussed once a week and never influences a decision in between, it belongs in an archive, not a live dashboard.
- Can the client understand it without a call. A metric that requires explanation every time it appears is not driving trust. It is creating a dependency on whoever explains it.
Running an existing report through these three questions almost always cuts it by half or more, and the resulting version is nearly always more useful than the original, not less.
Why Visibility Is Not the Same as Reporting Overhead
None of this argues against visibility. It argues against confusing visibility with volume. A shared dashboard that the client, the delivery lead, and the team can all read without needing a meeting to interpret it does more to build trust than any weekly status call ever will. Visibility, done well, changes behaviour before a single conversation happens, simply because everyone already knows where things stand.
The distinction matters because leadership teams under pressure to prove oversight often respond by adding more reporting rather than better reporting. That instinct is understandable and almost always counterproductive. A client who receives a cleaner three metric view develops more confidence in the managed team relationship than one buried in fifteen tabs, because clarity itself signals competence in a way that volume never does.
What Accountability Looks Like Once Reporting Is Clean
Once a managed team’s reporting is reduced to a small number of outcome focused metrics, the conversations that follow change in tone. A missed number stops being a personality problem and starts being a system question. What broke down. What was unclear. What did the process not support. That reframing does not remove individual accountability. It actually increases it, because people engage honestly with a system level question in a way they rarely do when the first instinct is to defend their own effort.
This is the same principle that separates managed team partnerships that mature quickly from ones that stay stuck in a staffing dynamic. The partners who name ownership clearly, including around what gets measured and why, are the ones clients trust with more responsibility over time. The ones still adding metrics reactively tend to stay stuck explaining numbers rather than improving them.
Building a Reporting Structure That Ages Well
The healthiest managed team reporting structures I have seen were designed once, deliberately, before the engagement ramped up, rather than assembled reactively across the first several months. That upfront design does not need to be elaborate. It needs three agreed metrics, one named owner for each, and a shared understanding of what action follows when a number moves in the wrong direction.
Leadership teams that get this right early rarely find themselves negotiating scope creep in their own reporting six months later. They spend that time instead on the actual delivery conversations that reporting was meant to enable in the first place, which is the entire point a dashboard exists to serve, not an end in itself. Teams that build this discipline early also tend to mature faster into the kind of trusted strategic partnership model that distributed capability centres eventually earn, because clean, honest metrics are what leadership actually uses to extend more responsibility.
If your team’s reporting has grown past the point where anyone can answer the delivery question in ten seconds, the fix is rarely a new tool. It is usually the uncomfortable exercise of cutting a report back to the three numbers that actually earn their place on the page, and trusting that the rest was never doing the work you assumed it was.
The Human Cost of Reporting That Never Gets Trimmed
There is a leadership dimension to this that rarely makes it into a process document. A team asked to feed fifteen metrics into a weekly report is a team spending real hours proving activity instead of improving it. That time does not show up as a line item anywhere, which is precisely why it survives so long uncut. Nobody budgets for it, so nobody notices it disappearing.
The managers who lead distributed teams well are usually the ones willing to have an uncomfortable conversation with a client about trimming a report the client themselves asked to expand over time. That conversation requires a kind of confidence that comes from having seen enough engagements to know which metrics actually predict outcomes and which ones simply feel reassuring to look at. Leading that conversation well, without sounding dismissive of a client’s original concern, is itself a leadership skill that separates managed team partners who earn long term trust from ones who simply comply with every reporting request that arrives.
It also changes morale on the delivery side in a way leadership rarely anticipates. Engineers and delivery staff who spend less time compiling reports and more time on the actual work they were hired to do tend to stay longer and perform more consistently. Reporting overhead is rarely framed as a retention risk, but in distributed teams operating across time zones, it quietly is one. Every hour spent updating a field nobody reads is an hour not spent on the work that client relationship actually depends on.
What This Looks Like When a Client Asks for More, Not Less
Not every client will accept a smaller report on the first conversation. Some genuinely believe more visibility is always better, and pushing back requires evidence rather than assertion. The most effective way I have found to make this case is showing, side by side, what a fifteen metric report actually predicted about delivery outcomes over the previous quarter against what the same three metrics would have predicted on their own. In almost every case, the three metric version tracks the real outcome just as closely, and sometimes more closely, because it was never diluted by numbers competing for the same attention.
That kind of evidence tends to land better than a philosophical argument about reporting discipline, because it gives the client something concrete to evaluate rather than asking them to simply trust a smaller report will still serve them. Once a client sees that the smaller version actually surfaces problems faster, the conversation about cutting reporting overhead becomes far easier to have again in future engagements.